Note: This guide refers to Source Defense's Security solution, for more information on this solution contact us.
|
Table of contents |
|
|
4.2 The events chart and table |
|
1 Main window
2 Dashboard reporting period
At the top left of the dashboard, you can select the reporting period:
3 Page view and sessions
- Page views: The number of page visits in a website monitored by Source Defense. To be specific, if a website has one page that is visited 1000 times during a reporting period, then the number of Page Views is 1000.
- Sessions: A session is a visitor login to logout or moving away from the monitored site. 30 minutes of inactivity on a website is deemed to be a session closed and a new one opened.
4 Event Summary
All events are counted on one of these two widgets:
The center of the widget shows the number of events found and not yet reviewed (marked as open) and the number of events already marked as reviewed for the site selected and the reporting period selected in the Dashboard Reporting Period.
These events affect approximately the number of sessions shown, and originate from the indicated number of scripts.
Mousing over the bar graph exposes a tooltip to show the breakdown of the severity level of these events:
The color codes match the bar graph colors.
5 Event List & Graph
Here is an example of the display for Open events:
The display for Reviewed events is similar:
There are two sets of controls.
- The first selects the events display type:
The left-hand icon, shown as selected, sets the events’ display to unhandled. Clicking the right-hand icon, sets the events display to handled. - The second set of controls sets the risk levels to be displayed:
The events matching the selected risk levels are shown individually in the list on the left and as counts in the graph on the right.
The following remarks apply to both Reviewed and Open displays:
- Event list columns description
Column Heading Description Events (Table name) Events are compiled from many types of signals Source Defense collects from the scripts’ behavior on the website. Risk Risk Icon Meaning Information Medium High Critical Event Type Event type is determined by what the script is doing on the website and the type of data being collected. Origin The origin is the name of the involved in the event. Type 3rd - 3rd party script invoked by the website directly or by a tag manager
4th+ - scripts that are invoked by a 3rd or higher party script
Exposed Sessions Estimated number of sessions on the site exposed to this event. - Column sorting:
In the event list, clicking any of the column headings causes the data to be sorted by that heading - Tooltips:
The EXP.S label has an associated mouse-over tooltip: Exposed Sessions.
Mousing over an event type yields a tooltip that expands the labels that are sometimes abbreviated, such as Data Exposure Suspected that will appear as Data Exposure Sus.
- Event drill down: Clicking anywhere on the line of an item takes you to the Scripts page of the respective event.
- The events graph:The list items appear to the right in an Events Graph. The graphs are live:
Mousing horizontally across the graph opens a box with the graph values at each time position.
- Changing the risk levels:
Changing the risk level changes the display:
If we deselect Medium the display changes:
The vertical scale adjusts to accommodate additional data.
6 Scripts
This shows the total number of 3rd party scripts detected on the site during the reporting period selected, and the amount of scripts belonging to each status:
- Identified - Scripts that were identified for further action
- In-policy - Scripts where a Source Defense policy is set
- Pending - Scripts where a Source Defense recommended policy is pending (including scripts In-policy other than the recommended policy)
- Blocked - Scripts set to be blocked
Policy assignments, script blocking, and other script control capabilities are features of Source Defense Protect and are not available in Source Defense Detect.
The type shows the invocation level of third party scripts:
- 3rd Party script invoked by website directly or by a tag manager
- 4th+ Party scripts that are invoked by a 3rd or higher party script.
Note that a script may belong to more than one group. For example, a script may be introduced as both a 3rd party and as a 5th party, for example.
7 Most events
The table lists the scripts with the largest number of event types.
Each script entry has a tooltip listing the event types that this script triggers:
4th+party scripts may have a “loaded by” tooltip to show which strict loaded that script:
Clicking on any of these scripts opens its respective script page window. See section 4.2 for details.
8 Observed script behavior
Number of scripts that have the following observed behavior are displayed:
For non-zero entries, there is a tooltip showing a list of scripts that triggered the indicated behavior.
For more information on the script behaviors, see the FAQ What are observed behaviors or observed script behaviors? [FAQ]
9 Request Map Pane
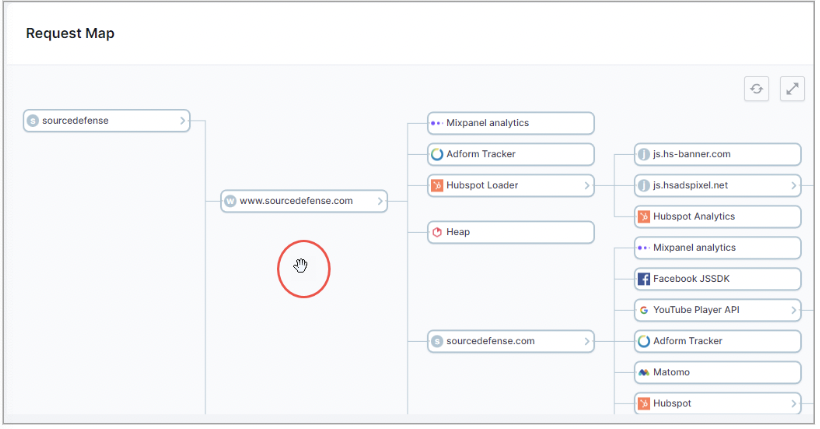
For a specific site (top level), the Request map shows the scripts used as an invocation hierarchy. Notice that the same script may appear in several levels.
The Request map can be navigated as follows: Mousing over it, changes the mouse pointer to a hand as shown. Hold down the left mouse button to drag the map around.
The top right buttons function as follows:
|
Go to full screen |
|
|---|---|
|
Restore the window to default display |
Clicking any script in the map opens its respective script page window. See section 4.2 for details.
10 Payment page headers for PCI
This feature can be turned on by request.
It shows whether or not the headers on the payment pages of the site have been changed.
An external process runs periodically to check if any changes were done on the payment pages since the last run.
If "Changes found" in red appears, it shows that there are changes in the headers of the payment page on the website found, that have not been marked as 'ignore always' (see payment headers section for more details).
If "No changes found" in green appears, it shows that there no new changes found in the headers of the payment page on the website and/or no changes marked as 'ignore always' (see payment headers section for more details) - show in red "Changes found" .
Click here for explanations on concepts and terms related to the Security solution.